Layers


Forest fires


Droughts

Erosion


Floods
-
Accumulated Precipitation (mm)
-
Extreme precipitation 1971-2000 (mm/day)
-
Change in extreme precipitation for +2°C (mm/day)
-
Reporting Points
-
Flood hazard map 50-year return period
-
Flood hazard map 100-year return period
-
Flood hazard 10 years - Spain (m)
-
Flood hazard 100 year (m)
-
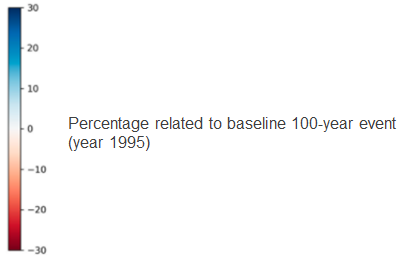
20 Year Return Period Exceedance (%)
-
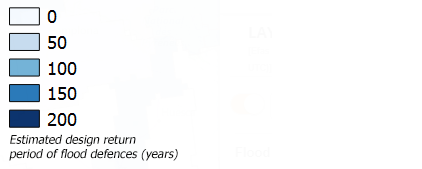
Flood Protection Levels
-
ERIC Affected area
-
Landslide Susceptibility
-
Projected relative change of mean discharge at +1.5ºC warming level
-
Projected relative change of mean discharge at +3.0ºC warming level
-
Projected relative change of extreme low discharge at +1.5ºC warming level
-
Projected relative change of extreme low discharge at +3.0ºC warming level
-
Projected relative change of extreme high discharge at +1.5ºC warming level
-
Projected relative change of extreme high discharge at +3.0ºC warming level


Pilot cases


Good practices
Forest fires
1.1 Good practice test
Droughts
Erosion
Floods
WMS Services
Base maps
-
OpenStreetMap
-
Satellite Sentinel-2 2018
Thematic maps
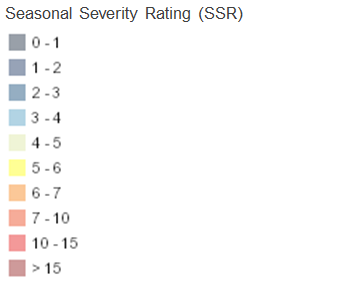
Fire risk depends on many factors, including climatic conditions, vegetation, forest management practices and other socio-economic factors.
The burnt area in the Mediterranean region where SUDOE mountains are located, increased from 1980 to 2000. Even if it has decreased thereafter, patterns and intensity of forest risk are changing because of climate change. In a warmer climate, more severe fire weather and, as a consequence, an expansion of the fire-prone area and longer fire seasons are projected across Europe. The impact of fire events is particularly strong in southern Europe.
Today there are many useful tools for the prevention and management of forest fires (mapping tools, databases, risk and vulnerability indicators among others).
More information
Complementary cartographic resources about fires in SUDOE mountain massifs:
- European Forest Fire Information System (EFFIS) map viewer
- EFFIS Long-term seasonal forecast of temperature and rainfall anomalies
- IMPACT2C Atlas - Forest fire vulnerability
- Global Forest Watch - Fires
- Urban population directly affected by forest fires 2000-2018
Complementary cartographic resources about fires in Catalunya:
- Delimitation of the areas burned by forest fires produced between 1986 and 2020
- Forest Fire Basic Hazard Map
- Classification of wooded areas according to the Fuel and Flammability Models
- Flammability assigned to each category of natural vegetation
- Municipalities with high risk of forest fire
- Priority protection perimeters for forest fire prevention
- Daily Wildfire Hazard Prediction Map
- Map of the Plan Alfa > actions of the forest fire surveillance and prevention troops deployed in the territory
Forest fires
Droughts
Erosion
Floods
-
Accumulated Precipitation (mm)
-
Extreme precipitation 1971-2000 (mm/day)
-
Change in extreme precipitation for +2°C (mm/day)
-
Reporting Points
-
Flood hazard map 50-year return period
-
Flood hazard map 100-year return period
-
Flood hazard 10 years - Spain (m)
-
Flood hazard 100 year (m)
-
20 Year Return Period Exceedance (%)
-
Flood Protection Levels
-
ERIC Affected area
-
Landslide Susceptibility
-
Projected relative change of mean discharge at +1.5ºC warming level
-
Projected relative change of mean discharge at +3.0ºC warming level
-
Projected relative change of extreme low discharge at +1.5ºC warming level
-
Projected relative change of extreme low discharge at +3.0ºC warming level
-
Projected relative change of extreme high discharge at +1.5ºC warming level
-
Projected relative change of extreme high discharge at +3.0ºC warming level
Pilot cases
Good practices
Forest fires
1.1 Good practice test
Droughts
Erosion
Floods
Base maps
-
OpenStreetMap
-
Satellite Sentinel-2 2018
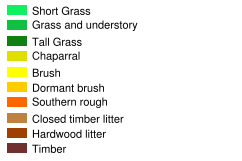
The recurrence of adverse weather events has a negative impact on agricultural and forestry production and producers' income. Drought is one of the most complex natural disasters, impacting more people in the world. The frequency and severity of meteorological and hydrological droughts have increased in most parts of Europe.
Different drought indices agree that the increase is greatest in southern Europe, where the SUDOE territory is located. In addition to its direct effects on production and socio-economic sectors , drought can affect drinking water supplies, or can affect forest fire risk by increasing the dryness of the fuel and the levels of soil erosion as well.
Available studies concerning climate change models and projections agree further increases in the frequency, duration and severity of meteorological and hydrological droughts in the coming decades for most the SUDOE region. As a consequence, an increased competition between different water users, such as agriculture, industry, tourism and households is expected also in mountain areas. The impacts of droughts depend on the vulnerability and the ability of communities to cope with the phenomenon, which in turn is influenced by the socio-economic, productive and resource quality conditions of the populations.
More information
Complementary cartographic resources about droughts in SUDOE mountain massifs:
Forest fires
Droughts
Erosion
Floods
-
Accumulated Precipitation (mm)
-
Extreme precipitation 1971-2000 (mm/day)
-
Change in extreme precipitation for +2°C (mm/day)
-
Reporting Points
-
Flood hazard map 50-year return period
-
Flood hazard map 100-year return period
-
Flood hazard 10 years - Spain (m)
-
Flood hazard 100 year (m)
-
20 Year Return Period Exceedance (%)
-
Flood Protection Levels
-
ERIC Affected area
-
Landslide Susceptibility
-
Projected relative change of mean discharge at +1.5ºC warming level
-
Projected relative change of mean discharge at +3.0ºC warming level
-
Projected relative change of extreme low discharge at +1.5ºC warming level
-
Projected relative change of extreme low discharge at +3.0ºC warming level
-
Projected relative change of extreme high discharge at +1.5ºC warming level
-
Projected relative change of extreme high discharge at +3.0ºC warming level
Pilot cases
Good practices
Forest fires
1.1 Good practice test
Droughts
Erosion
Floods
Base maps
-
OpenStreetMap
-
Satellite Sentinel-2 2018
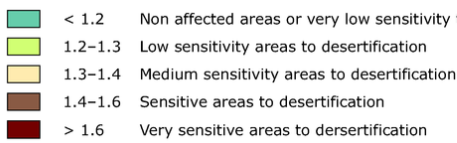
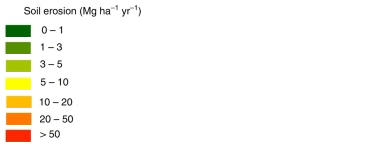
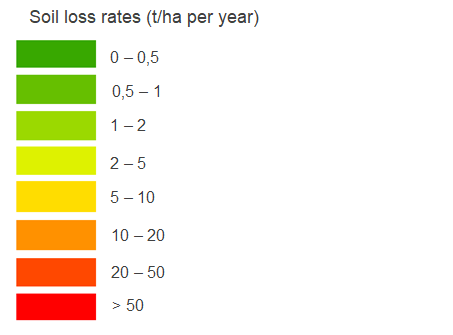
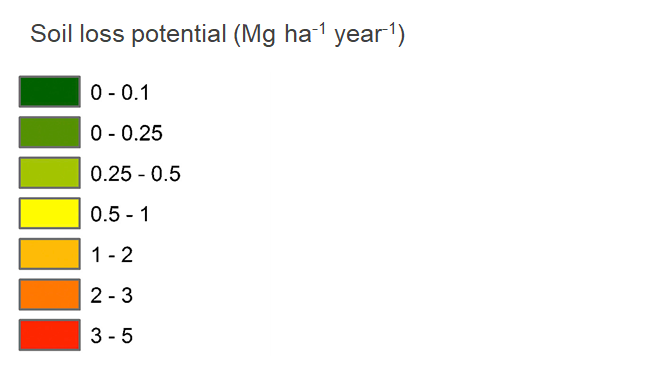
Soil erosion is the displacement of the upper layer of soil; it is a form of soil degradation. This natural process is caused by the dynamic activity of erosive agents.
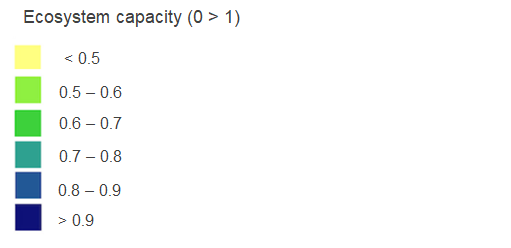
Soil erosion by water is one of the major threats to soils in South west Europe, with a negative impact on ecosystem services, crop production, drinking water and carbon stocks. Soil erosion may be a slow process that continues relatively unnoticed, or it may occur at an alarming rate causing a serious loss of topsoil (outermost layer of soi).
In arid and sub-arid climates, which are very common in the SUDOE region, the combination of erosive processes and other factors can trigger the process known as desertification. Desertification is a type of extreme land degradation in which biological productivity is lost due to natural processes or induced by human activities whereby fertile areas become increasingly arid. This spread of arid areas is caused by a variety of factors, such as climate change but also others human activities such as overexploitation of soil.
More information
Complementary cartographic resources about erosion in SUDOE mountain massifs:
- Global Assessment of Human-induced Soil Degradation (GLASOD)
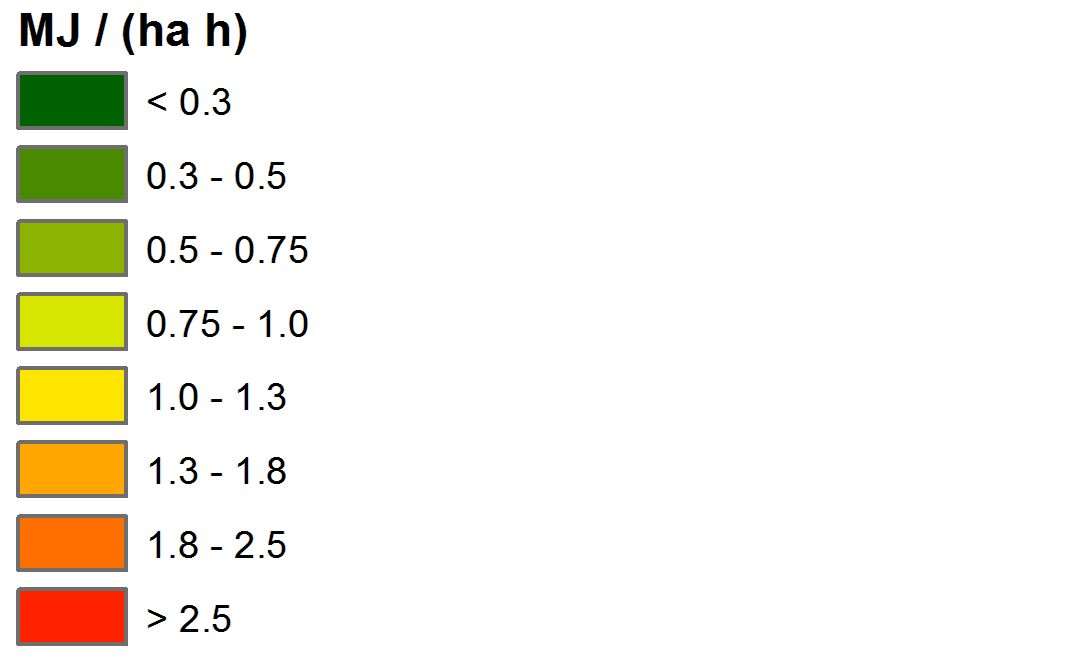
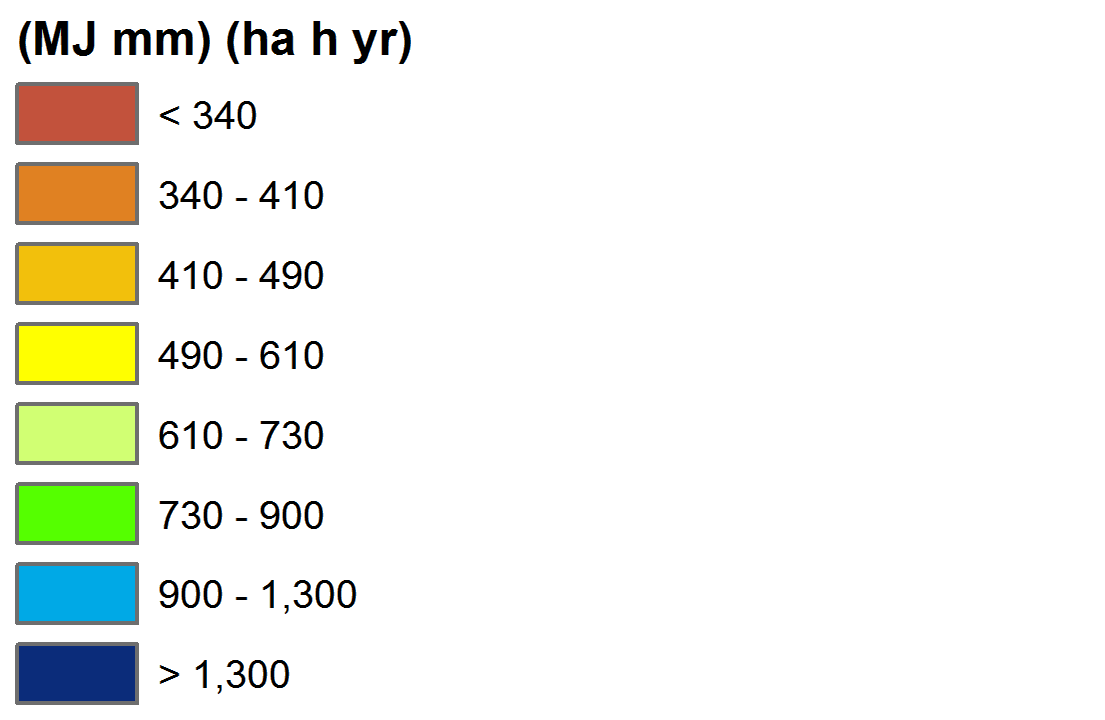
- Rainfall Erosivity in the EU and Switzerland (R-factor)
- European Landslide Susceptibility Map (ELSUS v2)
- Pan European Soil Erosion Risk Assessment - PESERA
- Soil erosion risk southern Europe
Complementary cartographic resources about erosion in Catalunya:
Forest fires
Droughts
Erosion
Floods
-
Accumulated Precipitation (mm)
-
Extreme precipitation 1971-2000 (mm/day)
-
Change in extreme precipitation for +2°C (mm/day)
-
Reporting Points
-
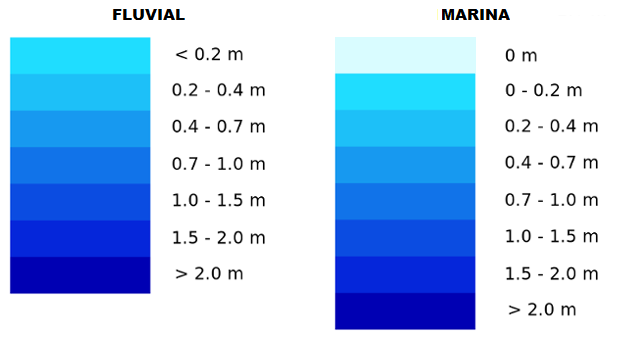
Flood hazard map 50-year return period
-
Flood hazard map 100-year return period
-
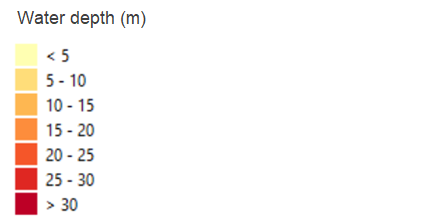
Flood hazard 10 years - Spain (m)
-
Flood hazard 100 year (m)
-
20 Year Return Period Exceedance (%)
-
Flood Protection Levels
-
ERIC Affected area
-
Landslide Susceptibility
-
Projected relative change of mean discharge at +1.5ºC warming level
-
Projected relative change of mean discharge at +3.0ºC warming level
-
Projected relative change of extreme low discharge at +1.5ºC warming level
-
Projected relative change of extreme low discharge at +3.0ºC warming level
-
Projected relative change of extreme high discharge at +1.5ºC warming level
-
Projected relative change of extreme high discharge at +3.0ºC warming level
Pilot cases
Good practices
Forest fires
1.1 Good practice test
Droughts
Erosion
Floods
Base maps
-
OpenStreetMap
-
Satellite Sentinel-2 2018
A flash flood is a rapid flooding of low-lying areas: washes, rivers, dry lakes and depressions. ‘Flood risk’ is defined as the likelihood of a flood occurring (from any source) combined with its associated effects on people, commerce and the environment.
The importance of flood risk management in EU policy is encapsulated in the 2007 Floods Directive. The Directive, which has been adopted in every Member State of the EU, sets out a framework for managing and reducing risks. Future climate change is projected to increase the occurrence and frequency of once-in-a-century river floods in most regions of the SUDOE territory, with the exception of parts of southern Spain.
Pluvial floods and flash floods, which are generally caused by intense precipitation extremes, are likely to become more frequent and intense at the SUDOE mountains. River floods are one of the most destructive threats of hydro-meteorological origin in terms of human lives and economic losses.
The main investigations on the subject coincide that under a high-emissions scenario, climate change could triple the direct damages from river floods during the 21st century in Europe in the absence of additional adaptation measures.
More information
Complementary cartographic resources about floods in SUDOE mountain massifs:
- EFAS - Flood and flash flood awareness system map viewer
- European past floods database
- Compound flood potential in Europe
- EFAS - Deterministic flood forecast
- INCA Flood Control - Monetary values 2006-2012
- European Flood Awareness System - River discharge and related forecasted data
- Projected change in heavy precipitation in winter (1971-2000 > 2071-2100; RCP 8.5)
Complementary cartographic resources about floods in Catalunya:
Forest fires
Droughts
Erosion
Floods
-
Accumulated Precipitation (mm)
-
Extreme precipitation 1971-2000 (mm/day)
-
Change in extreme precipitation for +2°C (mm/day)
-
Reporting Points
-
Flood hazard map 50-year return period
-
Flood hazard map 100-year return period
-
Flood hazard 10 years - Spain (m)
-
Flood hazard 100 year (m)
-
20 Year Return Period Exceedance (%)
-
Flood Protection Levels
-
ERIC Affected area
-
Landslide Susceptibility
-
Projected relative change of mean discharge at +1.5ºC warming level
-
Projected relative change of mean discharge at +3.0ºC warming level
-
Projected relative change of extreme low discharge at +1.5ºC warming level
-
Projected relative change of extreme low discharge at +3.0ºC warming level
-
Projected relative change of extreme high discharge at +1.5ºC warming level
-
Projected relative change of extreme high discharge at +3.0ºC warming level
Pilot cases
Good practices
Forest fires
1.1 Good practice test
Droughts
Erosion
Floods
Base maps
-
OpenStreetMap
-
Satellite Sentinel-2 2018